Manufacturing
by Alfred W. Stuart
Professor Emeritus of Geography, University of North Carolina at Charlotte, 2006.
Reprinted with permission from The North Carolina Atlas Revisited. Managing editor: Alfred W. Stuart.
Part 7: Statewide Distribution of Job Losses
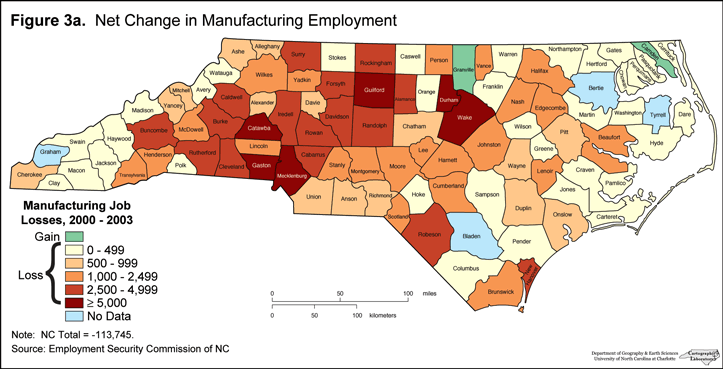
Between 2000 and 2003, North Carolina lost 182,000 factory jobs, a decline of 23 percent. The statewide distribution of these losses is shown in Figure 3(a). Losses of 5,000 or more were confined to central counties of some of the state’s larger metro areas, especially Catawba, Durham, Gaston, Guilford, Mecklenburg, and Wake counties. Together, these six counties accounted for 43 percent of the state’s total loss. Otherwise, most of the major losses were recorded in other larger industrial counties along the Piedmont corridor and in nearby western areas. Conversely, those counties that experienced smaller losses, mainly in the eastern and far western parts of the state, had smaller industrial labor forces to begin with. The only two counties that recorded gains, Granville and Camden, had increases of just 110 and 77 jobs, respectively.
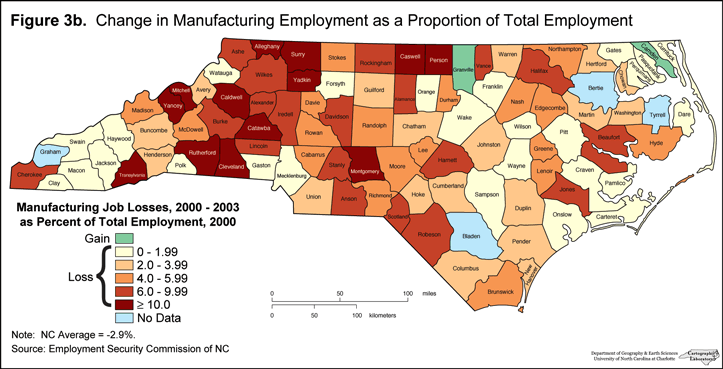
However, Figure 3 (b) puts these losses into a different context by showing factory jobs losses in relation to total employment, a measure of the overall impact of manufacturing declines on the local economy. Of the 11 counties for which factory job losses amounted to 10 percent or more of total employment, only one, Catawba, was among those losing 5,000 or more of such jobs. It and its surrounding counties have economies that are particularly concentrated in textiles, apparel and furniture manufacturing and all had declines that far exceed the statewide drop of 2.9 percent. The rest that had high proportions of losses were mostly in other western and eastern non-metro areas or in suburban parts of metro areas on the Piedmont. However, in the state’s two most populous counties, Mecklenburg and Wake, factory job losses exceeded 5,000 each but these losses amounted to 1.5 percent or less of total employment, a measure of their relatively more diverse economies.
In contrast to the pattern of absolute job losses, the losses of 4 to 10 percent of total employment were concentrated not only in a number of Piedmont counties but also in many parts of eastern North Carolina and in the western part of the state. The bulk of these are rural counties. This suggests that the local impact of these factory jobs losses on the overall economy was greater in a number of rural areas than the absolute jobs losses shown in Figure 1 would indicate.
While much of the concern about recent manufacturing jobs losses in the three traditional industry groups has focused on rural areas, the fact is that the bulk of these jobs are in or proximate to metro areas. For example, of the 12 counties that had at least 5,000 workers in the traditional industries, 10 are in metro areas and the remaining two (Rockingham and Surry) are adjacent to one. These 12 counties employed almost 53 percent of the state’s textiles/apparel/furniture factory workers in 2000 but collectively lost almost 23,000 of them by 2002, not counting the subsequent losses at the several Pillowtex plants. Catawba County, central to the Hickory-Morganton MSA, was the biggest loser of them all, with a decline of 4,800 jobs in the traditional industries during the two-year period. However, the fact remains that these metro counties have bigger and more diverse economies than do their rural counterparts. Thus, while the rural losses may have been smaller, they constituted, in most cases, a larger part of the local economy.


Keep reading >> Manufacturing- Part 8: Factory Closings: 2003-2006 ![]()
1 January 2006 | Stuart, Alfred W.